Skip to content

nokia routerlarda aynı anda up / down olan portları listelemek

nokia routerlar üzerinde aynı dakikalar içerisinde up/down olan portları bulmak için loglara bakmak en doğru yöntem olsada arayüzlerin last state change larından buna bakabiliriz. aşagıdaki basit komut işimize yarayacaktır.

A:router_a# environment no more 
A:router_a# show port detail | match expression "02/26/2026 12:2|Interface"


Interface          : esat-1/1/1                 Oper Speed       : 0 Mbps
Last State Change  : 11/18/2025 01:20:11        Hold time down   : 0 seconds

Interface          : esat-1/1/2                 Oper Speed       : 1 Gbps
Last State Change  : 02/26/2026 12:28:36        Hold time down   : 0 seconds

Interface          : esat-1/1/3                 Oper Speed       : 1 Gbps
Last State Change  : 02/10/2026 04:16:28        Hold time down   : 0 seconds

Interface          : esat-1/1/4                 Oper Speed       : 1 Gbps
Last State Change  : 02/26/2026 12:28:37        Hold time down   : 0 seconds

Interface          : esat-1/1/5                 Oper Speed       : 1 Gbps
Last State Change  : 02/26/2026 12:28:38        Hold time down   : 0 seconds

Interface          : esat-1/1/6                 Oper Speed       : 1 Gbps
Last State Change  : 02/26/2026 12:28:37        Hold time down   : 0 seconds

Interface          : esat-1/1/7                 Oper Speed       : 1 Gbps
Last State Change  : 02/26/2026 12:28:37        Hold time down   : 0 seconds

Interface          : esat-1/1/8                 Oper Speed       : 1 Gbps
Last State Change  : 02/26/2026 12:28:36        Hold time down   : 0 seconds

Nokia routerlarda toplu SDP oluşturma

nokia routerlarda toplu olarak sdp oluşturma ihtiyacı olurşursa aşağıdaki formatta bir excel dosyası oluşturup

sdpid routera routerb routerbip
10093 router_a routerb_b 10.10.10.1
4806 router_a routerb_d 10.10.10.3
1078 router_a routerb_f 10.10.10.5

aşagıdaki python kodu kullanarak oluşturduğumuz jinja formatına uygun kodları üretebiliriz… oluşturulacak routerda sdpid nin var olmaması gerekmektedir.

import pandas as pd
from jinja2 import Environment, FileSystemLoader

# Excel dosyasını oku
df = pd.read_excel('sdp_create.xlsx')

# Jinja2 ortamını ayarla (şablon dosyası ile aynı dizinde çalıştığını varsayıyoruz)
env = Environment(loader=FileSystemLoader('.'))
template = env.get_template('sdp_create_template.j2')

# Excel'den okunan veriyi listeye çevir
data = df.to_dict(orient='records')

# Jinja2 ile konfigürasyon dosyasını oluştur
output = template.render(items=data)

# Sonucu dosyaya yaz
with open('sdp_create_config.txt', 'w', encoding='utf-8') as f:
    f.write(output)

sdp_create_template.j2 dosyasında sdp mpls olarak oluşturulup ldp yi aktif ettiğimiz bir örnek var.

{% for item in items %}
/configure service sdp {{ item.sdpid }}  mpls create
info
description "to_{{ item.routerb }} "
far-end {{ item.routerbip }} 
ldp
path-mtu 2000
keep-alive
    shutdown
exit
no shutdown

{% endfor %}

https://github.com/ferhatcicek/ferhatcicek.com/tree/main/nokia%20routerlarda%20toplu%20sdp%20olusturma adresinden kodlara ve örnek excel dosyasına erişebilirsiniz

m-lab speedtest hız verilerine erişim

NDT, Measurement Lab (M‑Lab) tarafından geliştirilen açık kaynaklı bir ağ performans testi aracıdır; upload, download ve gecikme gibi parametreleri ölçer
M‑Lab NDT verileri açık şekilde Google Cloud Storage ve BigQuery üzerinden erişilebilir hâldedir..
Kullanılan M-Lab’in https://speed.measurementlab.net adresinden test yapabilmektedir.

Test sonuçlarının Türkiye verilerini incelemek amacıyla Google Cloud Console üzerinden veri çekmeye yönelik bir kod geliştirme ihtiyacı doğmuştur. Mevcut yöntemlerle veri alımı mümkün olsa da, Türkiye’de M-Lab servisi yaygın olarak kullanılmadığı için elde edilen veri setleri sınırlı ve temsil edici olmamaktadır.

nokia routerda vpls servis altındaki sapların silinmesi

nokia routerda belirli bir servis altındaki sapları silme ihtiyacı durumunda aşagıdaki kod kulllanılabilir.

import pandas as pd
from jinja2 import Environment, FileSystemLoader

# Excel dosyasını oku
df = pd.read_excel('sap_delete.xlsx')

# Jinja2 ortamını ayarla (şablon dosyası ile aynı dizinde çalıştığını varsayıyoruz)
env = Environment(loader=FileSystemLoader('.'))
template = env.get_template('sap_delete_template.j2')

# Excel'den okunan veriyi listeye çevir
data = df.to_dict(orient='records')

# Jinja2 ile konfigürasyon dosyasını oluştur
output = template.render(items=data)

# Sonucu dosyaya yaz
with open('sap_delete_config.txt', 'w', encoding='utf-8') as f:
    f.write(output)

üretilecek komut için aşagıdaki jinja template ini kullanyoruz..

{% for item in items %}
/configure service vpls {{ item.SvcId }} sap {{ item.PortId }} shutdown
/configure service vpls {{ item.SvcId }} no sap {{ item.PortId }} 
{% endfor %}

sap_delete_config.txt dosyasında tempalte sonucuna uygun konfigürasyon oluşmuş olacaktır..

kullanacağımız excel ise show service sap-using komutunun çıktısına uygun olarak aşagıdaki formatta olmaldıır..

PortIdSvcIdIngressIng.EgressEgr.AdmOpr
lag-40:1011.0123454none45noneUpDown
lag-42:1011.0123454none45noneUpDown
lag-44:1011.0123454none45noneUpDown

Gerekli kodları aşagdaıki github adresinden ulaşılabilir.

https://github.com/ferhatcicek/nokia-service-sap-delete

ookla speedtest verisini indirme ve analiz etmek

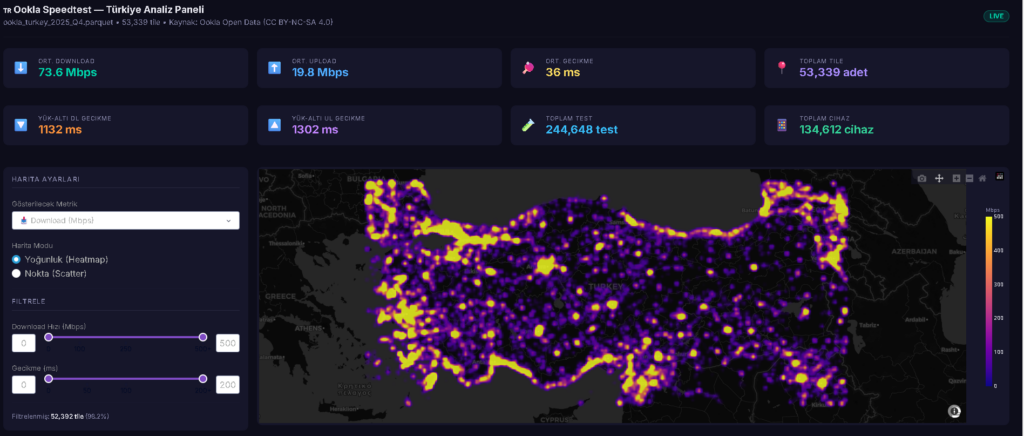
5g olaylarından dolayı hız testleri gündemde. bilinen ve doğru sonuç veren çok fazla hız testi sayfası yok. neredeyse hiç birinin açık verisi bulunmuyor. ookla nın çeyrek halinde yayınlandığı veriler bulunuyor ancak bu veriler çok kısıtlı.. örnek olarak operatör bilgisi bulunmuyor. bilr bölge için genel hız testi sonuçlarını incelemeye yardımcı olabiliryor.. açık veriler yılın çevrekleri şeklinde yayınlanıyor.

dosyalar belirli bir yapıya göre yayınlanıyor. en son yayınlanan çevrek verilerine göre türkiye verilerini indirecek bir python kod yazalım. verilerde doğrudan ülke bilgisi bulunmuyor. türkiyeyi içine alan koordinat bilgilerini kullanacağız. dikdörtgen şeklinde bir veri çekeceğimiz için sınırımızda diğer ülke verileride içinde yer alıyor.

kodu çalıştırdığımızda

ookla_turkey_2025_Q4.parquet

isminde bir dosyamız olacak.. bu dosya içerisindeki verileri incelemek için biraz görsellik katalım… dash kullanarak aşagıdaki kodu oluşturdum

kodu çalıştırdığımızda http://127.0.0.1:8050/ adresinde aşagıdaki sınucu göreceğiz..

github üzerinden proje kodlarına erişebilirsiniz :

https://github.com/ferhatcicek/ookla-turkiye-speedtest-opendata

ipv6 konfigüre edin, isteyin, talep edin, ısrarcı olun

ping sonucuna bakınca durumu daha net anlayacaksınız.

ping google.com

Pinging google.com [192.178.24.14] with 32 bytes of data:
Reply from 192.178.24.14: bytes=32 time=60ms TTL=112
Reply from 192.178.24.14: bytes=32 time=59ms TTL=112
Reply from 192.178.24.14: bytes=32 time=58ms TTL=112
Reply from 192.178.24.14: bytes=32 time=63ms TTL=112

Ping statistics for 192.178.24.14:
    Packets: Sent = 4, Received = 4, Lost = 0 (0% loss),
Approximate round trip times in milli-seconds:
    Minimum = 58ms, Maximum = 63ms, Average = 60ms

ping -6 google.com

Pinging google.com [2a00:aaaa:aaaa:820::aaaa] with 32 bytes of data:
Reply from 2a00:aaaa:aaaa:820::aaaa: time=39ms
Reply from 2a00:aaaa:aaaa:820::aaaa: time=37ms
Reply from 2a00:aaaa:aaaa:820::aaaa: time=38ms

Ping statistics for 2a00:1450:4017:820::200e:
    Packets: Sent = 4, Received = 4, Lost = 0 (0% loss),
Approximate round trip times in milli-seconds:
    Minimum = 37ms, Maximum = 39ms, Average = 38ms

nokia olt ve ont reboot

nokia marka olt yi reboot etmek için

admin equipment reboot-isam without-self-test

ont yi reboot etmek için ise

admin equipment ont interface 1/1/1/1/1 reboot with-active-image

komutlarını kullanabiliriz. ont reboot sırasında interface i doğru girmemiz gerekmektedir.

nokia olt de nt portunun sinyal seviyelerini kontrol etmek

isadmin>#  show equipment diagnostics sfp nt-b:xfp:2 detail 
================================================================================
sfp table (detailed)
================================================================================

--------------------------------------------------------------------------------
sfp
--------------------------------------------------------------------------------
              position : nt-b:xfp:2                                            
     diag-avail-status : no-error                                              
                   los : no-los                                                
              tx-fault : no-tx-fault   
              tx-power : "-2.86 dBm"                                           
              rx-power : "-17.72 dBm"                                          
       tx-bias-current : "33.18 mA"                                            
        supply-voltage : "3.32 VDC"                                            
           temperature : "36.70 degrees Celsius"                               
       temperature-tca : normal-value                                          
           voltage-tca : normal-value                                          
      bias-current-tca : normal-value                                          
          tx-power-tca : normal-value                                          
          rx-power-tca : low-alarm-th                                          
       rssi-profile-id : 65535                      rssi-state : enable         
================================================================================

huawei routerların arayüzlerinde trafik ve mib değerlerini sıfırlamak

bir arayüz üzerinden hata geliyor ve yapılan müdehaleler sonrasında sorunun devam edip etmediğini görmek istiyorsak interface sayaç değerlerini sıfırlamak işleri kolaylaştıracaktır. aşagıdaki örnek arayüzde CRC errorları dikkat çekmektedir…

[~router]display interface 50|100GE 5/1/0
50|100GE5/1/0 current state : UP (ifindex: 212)
Line protocol current state : UP 
Link quality grade : GOOD
Description: interface
Route Port,The Maximum Transmit Unit is 9212 
IP Sending Frames' Format is PKTFMT_ETHNT_2, Hardware address is 6dc4-6dc4-6dc4
Factor/Module: QSFP28, Standard: 100GBASE-LR4, FecMode: Disable
The Vendor PN is RTXM290-806
The Vendor Name is WTD
Port BW: 100G, Transceiver max BW: 100G, Transceiver Mode: SingleMode
Connector Type: LC, Transmission Distance: 10km
WaveLength: 1295.56nm 1300.05nm 1304.58nm 1309.14nm
Rx Warning range: [-10.599,  4.500]dBm, Tx Warning range: [-4.300,  4.500]dBm
Rx0 Power:  -7.40dBm, Tx0 Power:   1.57dBm
Rx1 Power:  -6.83dBm, Tx1 Power:   2.04dBm
Rx2 Power:  -6.83dBm, Tx2 Power:   1.99dBm
Rx3 Power:  -6.74dBm, Tx3 Power:   2.02dBm
Loopback: none, LAN full-duplex mode, Pause Flowcontrol: Receive Enable and Send Enable
Port Speed Switch Mode: manual
Last physical up time   : 2026-02-24 11:51:30+03:00
Last physical down time : 2026-02-24 11:49:07+03:00
Current system time: 2026-02-24 13:19:54+03:00
Statistics last cleared:2024-12-16 07:53:02+03:00
    Last 300 seconds input rate: 1477811763 bits/sec, 280550 packets/sec
    Last 300 seconds output rate: 1527603379 bits/sec, 232249 packets/sec
    Input peak rate 1477811763 bits/sec, Record time: 2026-02-24 13:19:54+03:00
    Output peak rate 1527634378 bits/sec, Record time: 2026-02-24 13:19:54+03:00
    Input: 3342830018023050 bytes, 5756490768291 packets
    Output: 6834371174146959 bytes, 8252820686074 packets
    Input:
      Unicast: 5756432761945 packets, Multicast: 58006026 packets
      Broadcast: 320 packets, JumboOctets: 405942739572 packets
      CRC: 771506832 packets, Symbol: 80511712 packets
      Overrun: 0 packets, InRangeLength: 0 packets
      LongPacket: 0 packets, Jabber: 0 packets, Alignment: 0 packets
      Fragment: 0 packets, Undersized Frame: 0 packets
      RxPause: 0 packets
    Output:
      Unicast: 8252768032451 packets, Multicast: 52653468 packets
      Broadcast: 155 packets, JumboOctets: 1274128818374 packets
      Lost: 0 packets, Overflow: 0 packets, Underrun: 0 packets
      System: 0 packets, Overruns: 0 packets
      TxPause: 0 packets
    Local fault: normal, Remote fault: normal.
    Last 300 seconds input utility rate:  1.47%
    Last 300 seconds output utility rate: 1.52%

şimdi bu verileri temizleyelim.. öncelikle konfig moddan çıkılması gerekmektedir. sonrasında reset counter komut ile ilgili arayüze ait veriler sıfırlanabilir.

[~router]quit
<router>reset counters interface 50|100GE 5/1/0
Info: This operation resets the counters in the display interface command output on this interface.
Info: Reset successfully.
<router>

şimdi kontol edelim

<router>display interface 50|100GE 5/1/0
50|100GE5/1/0 current state : UP (ifindex: 212)
Line protocol current state : UP 
Link quality grade : GOOD
Description: interface
Route Port,The Maximum Transmit Unit is 9212 
IP Sending Frames' Format is PKTFMT_ETHNT_2, Hardware address is 6dc4-6dc4-6dc4
Factor/Module: QSFP28, Standard: 100GBASE-LR4, FecMode: Disable
The Vendor PN is RTXM290-806
The Vendor Name is WTD
Port BW: 100G, Transceiver max BW: 100G, Transceiver Mode: SingleMode
Connector Type: LC, Transmission Distance: 10km
WaveLength: 1295.56nm 1300.05nm 1304.58nm 1309.14nm
Rx Warning range: [-10.599,  4.500]dBm, Tx Warning range: [-4.300,  4.500]dBm
Rx0 Power:  -7.40dBm, Tx0 Power:   1.58dBm
Rx1 Power:  -6.83dBm, Tx1 Power:   2.05dBm
Rx2 Power:  -6.83dBm, Tx2 Power:   1.97dBm
Rx3 Power:  -6.71dBm, Tx3 Power:   2.05dBm
Loopback: none, LAN full-duplex mode, Pause Flowcontrol: Receive Enable and Send Enable
Port Speed Switch Mode: manual
Last physical up time   : 2026-02-24 11:51:30+03:00
Last physical down time : 2026-02-24 11:49:07+03:00
Current system time: 2026-02-24 13:28:10+03:00
Statistics last cleared:2026-02-24 13:28:01+03:00
    Last 300 seconds input rate: 1407061768 bits/sec, 273766 packets/sec
    Last 300 seconds output rate: 1454198771 bits/sec, 222001 packets/sec
    Input peak rate 1407061768 bits/sec, Record time: 2026-02-24 13:28:10+03:00
    Output peak rate 1454872520 bits/sec, Record time: 2026-02-24 13:28:10+03:00
    Input: 1684316592 bytes, 2702946 packets
    Output: 1743681595 bytes, 2184529 packets
    Input:
      Unicast: 2702931 packets, Multicast: 15 packets
      Broadcast: 0 packets, JumboOctets: 99374 packets
      CRC: 0 packets, Symbol: 0 packets
      Overrun: 0 packets, InRangeLength: 0 packets
      LongPacket: 0 packets, Jabber: 0 packets, Alignment: 0 packets
      Fragment: 0 packets, Undersized Frame: 0 packets
      RxPause: 0 packets
    Output:
      Unicast: 2184515 packets, Multicast: 14 packets
      Broadcast: 0 packets, JumboOctets: 212072 packets
      Lost: 0 packets, Overflow: 0 packets, Underrun: 0 packets
      System: 0 packets, Overruns: 0 packets
      TxPause: 0 packets
    Local fault: normal, Remote fault: normal.
    Last 300 seconds input utility rate:  1.40%
    Last 300 seconds output utility rate: 1.45%

Back To Top